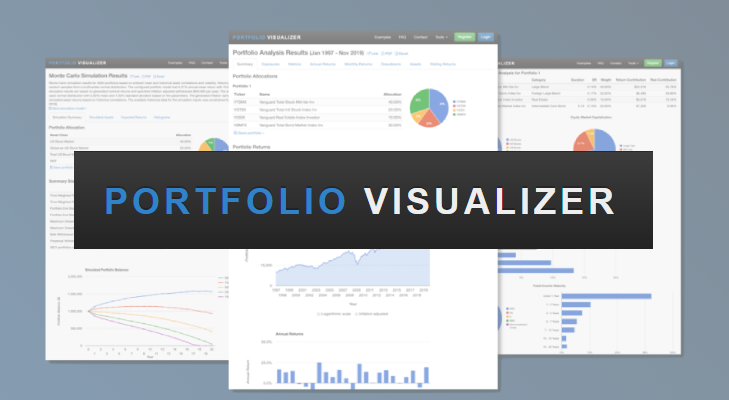
Portfolio Visualizer is a popular tool used by investors to analyse portfolio performance, asset allocation, and risk management. While traditionally focused on stocks, bonds, and mutual funds, the growing importance of cryptocurrency has led many to seek ways to include crypto assets in their overall portfolio analysis. By uploading crypto data CSV files, users can seamlessly integrate their cryptocurrency holdings into Portfolio Visualizer for a comprehensive view of their investment performance.
In this guide, we will walk you through the process of uploading your cryptocurrency data using CSV files into Portfolio Visualizer. Whether you are a seasoned crypto investor or just getting started, this step-by-step guide will help you organise and analyse your portfolio with ease. We will also explore some of the features available in the free Portfolio Visualizer version and how you can get the most out of this powerful tool.
Understanding Portfolio Visualizer

Portfolio Visualizer is a comprehensive portfolio management and analysis tool that allows users to assess the performance and risk of their investments. Originally designed for traditional asset classes like stocks and bonds, Portfolio Visualizer has evolved to include custom data uploads, including cryptocurrencies.
Why Use Portfolio Visualizer for Crypto?
- Performance Tracking: Monitor the growth and performance of your crypto assets alongside your other investments.
- Risk Assessment: Understand the risks involved in holding volatile crypto assets and compare them to traditional investments.
- Diversification Insights: See how crypto fits into your broader portfolio and whether it improves or worsens your diversification.
Preparing Your Crypto Data CSV Files
Before you can upload your cryptocurrency data to Portfolio Visualizer, you need to prepare your data in a CSV format. A CSV file (Comma-Separated Values) is a simple file format used to store tabular data such as date, asset name, amount, and value. This section will guide you on how to prepare your crypto data correctly.
What Should Your CSV File Include?
- Date: The date of each transaction or price point.
- Asset: The name of the cryptocurrency (e.g., Bitcoin, Ethereum).
- Amount: The quantity of the cryptocurrency you own.
- Price: The price at the time of transaction or for the period.
- Value: The value of your holding at the given date.
Tools for Creating Crypto CSV Files
- Wallets & Exchanges: Most crypto wallets and exchanges, such as Binance, Coinbase, and Kraken, allow users to export their transaction history as a CSV file.
- Crypto Portfolio Trackers: Tools like CoinTracking and Delta offer CSV export options to easily download your transaction history for multiple assets.
- Tax Tools: Crypto tax calculators like Koinly or CryptoTax can also export data in CSV format, especially helpful if you want to track cost basis and profits.
Creating a Portfolio Visualizer Account
To upload your crypto data, you will need a Portfolio Visualizer account. Luckily, creating an account is straightforward, and the free version includes many useful features for portfolio analysis.
How to Create an Account:
- Go to PortfolioVisualizer.com and click on Sign Up.
- Enter your email and create a password.
- After confirming your account, you’ll have access to free tools such as portfolio backtesting, Monte Carlo simulations, and asset correlation analysis.
While the free version offers plenty of features, Portfolio Visualizer also has premium features that provide more advanced analyses. However, for most users, the free version is sufficient for crypto portfolio uploads.
Uploading Crypto Data CSV Files
Once your CSV file is ready, you can begin uploading it to Portfolio Visualizer.
Step-by-Step Guide:
- Log in to Your Account: After signing in to your Portfolio Visualizer account, go to the Custom Asset Class or Portfolio Analysis section, depending on your goals.
- Navigate to the Upload Section: Click on the option to upload a new portfolio or custom data. You will see a prompt to upload your CSV file.
- Select Your CSV File: Choose the CSV file containing your cryptocurrency data and upload it. Make sure the file is formatted correctly with the necessary columns for date, asset, and value.
- Assign Labels and Categories: After uploading, you may need to assign labels to your assets (e.g., Bitcoin, Ethereum) and specify the time frame for analysis.
- Submit for Analysis: Once all the information is correct, submit the data for analysis.
Troubleshooting Common Errors
- File Formatting Issues: Ensure your CSV file is properly formatted, with commas separating values and no missing data.
- Data Mismatch: Make sure that the dates and values in your CSV are consistent and aligned with the time frames supported by Portfolio Visualizer.
- Unsupported Assets: If you are using a very new or niche cryptocurrency, check whether Portfolio Visualizer supports it in the custom asset class upload.
Analyzing Your Crypto Portfolio
After successfully uploading your crypto data, it’s time to dive into the analysis.
Key Metrics to Focus On:
- Return: See how your crypto assets have performed over time and compare this with other assets in your portfolio.
- Risk: Measure the volatility of your crypto holdings and compare it to traditional investments like stocks and bonds.
- Allocation: Analyse how much of your portfolio is allocated to crypto and whether this allocation fits your risk tolerance and investment goals.
Adjusting Settings for Deeper Insights
Portfolio Visualizer allows users to customise their analyses. You can adjust the time period, risk factors, and asset weights to see different outcomes. For example, you can simulate how adding or removing crypto from your portfolio affects overall performance.
Advanced Features of Portfolio Visualizer
Once you have the basics down, you may want to explore some of the more advanced features Portfolio Visualizer offers:
Monte Carlo Simulations This tool allows you to run simulations of how your portfolio might perform under different market conditions. It can be particularly useful for assessing the risk of your crypto investments.
Asset Correlations Analyse how your crypto holdings correlate with other assets in your portfolio. Do they move in the same direction as stocks, or do they act as a hedge during market downturns?
Upgrading to Premium While the free version of Portfolio Visualizer offers plenty of functionality, upgrading to premium gives you access to more detailed analyses and tools such as tax efficiency analysis and tactical asset allocation models. Depending on your needs, this upgrade may be worth considering.
Conclusion
Integrating cryptocurrency data into Portfolio Visualizer allows you to take a holistic view of your investments. By following this guide, you can easily upload your crypto data CSV files and start analysing your portfolio’s performance, risk, and asset allocation. Whether you are using the free Portfolio Visualizer version or considering an upgrade, the insights gained can help you make more informed investment decisions.
For more in-depth information about cryptocurrency tools and analysis, be sure to check out CryptoVedas for expert insights and resources.


